
Hello,
I am in the first year of Preparatory Class and I am trying to reproduce, using Flow simulation, the polars (lift and drag coefficients according to the angle of attack of the wing).
I have done several studies on Solidworks with the same wing profile segment but I get a wing stall much too late (around 30 ° instead of 15 ° -18 °).
I have different questions:
1- I carried out a study without tunnel (or boxes) around the pieces of wing profile and I wonder how that changes the result of putting one in the simulation of solidworks? (because with a kind of tunnel I can set up a wind over a large area at the entrance and environmental pressure at the exit) I tried and I found the same in drag force but lift force is too small...
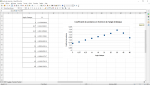
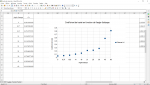
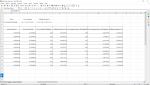
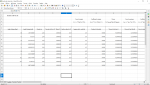
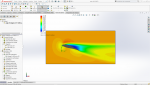
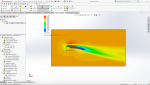
2- Attached a spreadsheet where I entered the lift and drag forces given by solidworks at different angles of attack, and I plotted the drag coefficient and lift curves in depending on the angle of attack. Problem: The wing stall happens much later than expected as can be seen on the graph (right on the spreadsheet), I checked everything and I do not understand how it is possible. Especially on the surface visualizations proposed by solidworks (in speed and pressure) I can see perfectly well the turbulent zone behind the wing decreases but not the lift force!
I tried everything, global, surface, volume objective to try to see a difference but nothing helped!
Hope you can advance my problem.
Thank you in advance !
I am in the first year of Preparatory Class and I am trying to reproduce, using Flow simulation, the polars (lift and drag coefficients according to the angle of attack of the wing).
I have done several studies on Solidworks with the same wing profile segment but I get a wing stall much too late (around 30 ° instead of 15 ° -18 °).
I have different questions:
1- I carried out a study without tunnel (or boxes) around the pieces of wing profile and I wonder how that changes the result of putting one in the simulation of solidworks? (because with a kind of tunnel I can set up a wind over a large area at the entrance and environmental pressure at the exit) I tried and I found the same in drag force but lift force is too small...
2- Attached a spreadsheet where I entered the lift and drag forces given by solidworks at different angles of attack, and I plotted the drag coefficient and lift curves in depending on the angle of attack. Problem: The wing stall happens much later than expected as can be seen on the graph (right on the spreadsheet), I checked everything and I do not understand how it is possible. Especially on the surface visualizations proposed by solidworks (in speed and pressure) I can see perfectly well the turbulent zone behind the wing decreases but not the lift force!
I tried everything, global, surface, volume objective to try to see a difference but nothing helped!
Hope you can advance my problem.
Thank you in advance !